GEOTECHNICAL ENGINEERING
HOUSTON
HomeGeophysicsSeismic tomography (refraction/reflection)

Seismic Tomography: Refraction and Reflection Surveys in Houston

Evidence-based design. Reliable delivery.

LEARN MORE

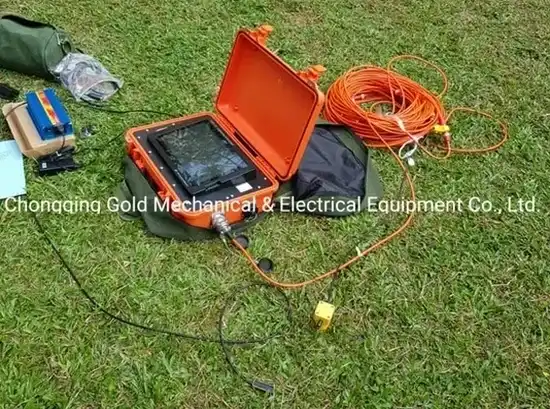
A geophone spread cable rolls out across a vacant tract near Buffalo Bayou: 24-channel arrays with 4.5 Hz vertical-component receivers, connected to a 24-bit seismograph that records first arrivals and reflections at sub-millisecond sampling intervals. In Houston, seismic tomography tackles a specific problem—the thick, unconsolidated Beaumont Formation clays and Pleistocene terrace deposits that blanket the metropolitan area from Katy to Baytown. These sediments, often exceeding 600 meters in depth before reaching competent bedrock, mask buried faults, paleochannels, and abrupt facies changes that affect foundation design. The refraction method maps the compressional-wave velocity (Vp) of successive layers by analyzing critically refracted head waves, while the reflection technique images deeper impedance contrasts tied to the Fleming Formation and underlying Vicksburg Group. Together, they produce a continuous velocity model of the subsurface that no drilling program alone can supply across the spatial scales required for large Houston developments. When a high-resolution stratigraphic profile is needed before committing to a deep boring plan, the team often runs a preliminary MASW survey to constrain shear-wave velocities in the upper 30 meters, then extends the imaging depth with refraction tomography.

A well-constrained seismic velocity model turns a single boring log into a calibrated cross-section spanning hundreds of meters—essential in Houston's faulted, laterally variable geology.
Our service areas

Process overview

Houston sits at roughly 15 meters above mean sea level, yet its subsurface tells a far more complex story: the city overlies more than 300 mapped faults—many of them growth faults—that deform Quaternary sediments through differential subsidence and natural compaction. Seismic tomography in this setting must resolve velocity contrasts as subtle as 200 m/s across fault planes while penetrating through gas-charged zones common in the upper Beaumont clays. A typical survey deploys 48 to 96 channels with 5-meter geophone spacing, using a 12-pound sledgehammer on an aluminum strike plate for shallow refraction or an accelerated weight drop for reflection targets down to 150 meters. First-break picking followed by ray-tracing inversion yields a 2D velocity cross-section with root-mean-square misfits below 5 percent. For deeper targets, Common Midpoint stacking of reflection data images the Fleming Formation top—a critical marker for regional subsidence studies—at approximately 400 meters depth beneath downtown Houston. This velocity information feeds directly into site classification per ASCE 7 Chapter 20, allowing the project geotechnical engineer to determine the appropriate Site Class without relying solely on SPT N-values. On projects where soft clay thickness exceeds 15 meters, we often recommend pairing the tomography results with CPT soundings to calibrate the seismic velocities against measured tip resistance and pore pressure dissipation data.
Seismic Tomography: Refraction and Reflection Surveys in Houston
Technical reference — Houston

Local context

Seismic tomography proves its value in Houston when comparing sites near the Addicks Reservoir to those in the Heights. The Addicks area is underlain by Quaternary alluvium containing clay and sand layers, where compressional wave velocities in the top 15 meters are frequently under 600 m/s. In contrast, the Heights sits on older Pleistocene deposits with velocities greater than 1,200 m/s. Foundations suitable for one location will not work for the other. Furthermore, hidden growth faults oriented parallel to the Long Point-Eureka Heights trend can bring these differing materials within 50 meters of each other. Before any piles are installed, seismic tomography detects these lateral velocity variations and maps fault lines that standard boreholes spaced 30 meters apart typically overlook. Additionally, this approach pinpoints low-velocity zones linked to gas buildup in organic-rich clays of the Beaumont Formation, where SPT blow counts can misleadingly appear high because of pore gas expansion. Disregarding such anomalies causes differential settlement that becomes evident within five years after a building enters service.

Need a geotechnical assessment?

Reply within 24h.

Email: contact@geotechnicalengineering1.org

Reference standards


Relevant standards include ASTM D5777-18 for seismic refraction, ASCE 7-22 Chapter 20 for site classification, IBC 2021 Section 1613 for earthquake loads, and ASTM D7128-18 for shallow seismic reflection.

Technical data

ParameterTypical value
Survey geometry48–96 channels, 3–10 m receiver spacing, 60–240 m spread length
Energy source for refraction12–16 lb sledgehammer on aluminum plate; accelerated weight drop for deeper targets
Recording instrument24-bit seismograph, 0.25–0.50 ms sampling interval, GPS time synchronization
Maximum imaging depth (refraction)30–50 m with hammer source; up to 100 m with weight drop in unconsolidated sediments
Maximum imaging depth (reflection)150–500 m depending on source energy and stratigraphic impedance contrasts
Velocity range mapped250–400 m/s (unsaturated clay) to 1,800–2,400 m/s (dense Pleistocene sands and silty materials)
Data processing workflowFirst-break picking → ray-tracing inversion (refraction); CMP sorting → NMO correction → stacking (reflection)
Reporting standardASCE 7-22 Chapter 20 Site Classification; IBC 2021 Section 1613; ASTM D5777-18

Questions and answers


What depth can seismic tomography reach in Houston's Gulf Coast sediments?

Refraction tomography using a sledgehammer source over 240-meter spreads consistently provides imaging down to depths of 30–50 meters in the loose Beaumont clays. If an accelerated weight drop or small explosive is used, the effective depth increases to 80–100 meters. When conducting reflection surveys aimed at the Fleming Formation and deeper horizons, common-midpoint stacking can detect impedance changes as deep as 400–500 meters below downtown Houston.

How does seismic tomography compare to SPT borings for site characterization?

SPT borings and seismic tomography serve complementary roles. A single boring gives a direct penetration resistance value and enables sample collection at one point, whereas tomography yields a continuous velocity profile along the whole line. This technique reveals lateral variations such as faults, channel margins, and buried scour that wide boring spacing overlooks, and the borings in turn adjust the velocity model based on actual stratigraphy and material characteristics.

Can seismic tomography detect the active faults mapped beneath Houston?

Indeed, growth faults across Houston generally displace Quaternary deposits by 3 to 15 meters, creating noticeable velocity differences and breaks in reflectors. These features can be imaged using refraction tomography or high-resolution reflection profiling. The technique works especially well along established fault corridors like the Long Point-Eureka Heights and Willow Creek trends, where velocity anomalies of 200–400 m/s along the fault plane are commonly identified.

What does a seismic tomography survey cost for a typical Houston commercial site?

For a typical commercial lot in Houston, seismic tomography studies involving one to three survey lines with both refraction and some reflection work normally cost between US$3,050 and US$5,960. The final price varies with line length, channel count, source selection, and required investigation depth. When deeper reflection imaging or extensive 3D grids are called for, the cost will be at the higher end of that bracket.

Location and service area

We serve projects across Houston and surrounding areas.

View larger map